Data Analysis and Visualization using R
(DAVuR)
Course code: BFVH24DAVUR
This course teaches the fundamentals of data analysis, data exploration and data visualization
using the programming language R, and in particular the set of packages of the Tidyverse.
The course program lists what the topics for each
lesson are. Besides this, it serves as a reference for the resources on each topic: eBook chapters, presentations,
videos and exercises. This makes it easy to take the course in a self-paced fashion as well.
All videos are accessible via the "Video channel" link in the navbar.

Course eBook
The eBook for this course. The topics are discussed more elaborate than the presentations. It also holds the course exercises.

Datasets
Link to the "datasets" repository on github that is referred to from within the exercises.
The Tidyverse
Overview of the tidyverse
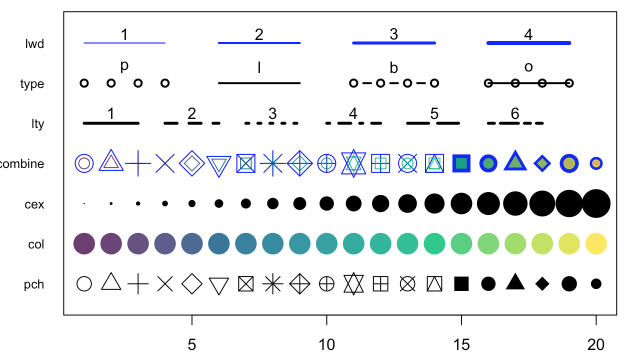
R plot parameters
The parameters you can use for modifying the look of a plot

R cheat sheet
A cheat sheet for R
Presentation 1: Toolbox
A brief overview of the tools in the R toolbox: R, RStudio, RMarkdown and Swirl.
Presentation 2a: Basic R
The basic datatypes and functionality of R are explored.
Presentation 2b: Basic R plotting
A first iteration of some plotting techniques.
Presentation 3: Complex Datatypes
You will get to know the more complex of the R data types: Factor, List, Dataframe.
Presentation 4: Functions
An overview of the most important functions from base R is presented.
Presentation 5: Scripting
This presentation deals with creating custom functions and scripts.
Presentation 6: Dataframe manipulations
All functions and techniques used fo manipulating dataframes (and lists) are discussed. These include 'with', 'subset', 'apply', 'aggregate', 'split'.