17 Packages
Until now, you have probably installed and imported many R packages, but one of them your own.
There are two main reasons why you would create your own packages:
- You want to reuse some functions in multiple projects that you work on.
- You want to share functions and data with a wider community, maybe with FAIR science in mind.
This chapter outlines the basic workflow for creating, developing, documenting and deploying your package.
For a real in-depth discussion, you should read the excellent free e-Book R Packages by Wickham and Bryan.
17.1 Prerequisites
You need the following packages to get started with developing your own package:
-
devtoolswhich itself loads some other packages as well. usethis
17.2 Setting up
The usethis package has a convenience method to create a new package:
usethis::create_package("demopackage")Note: I use the package name prefix with two colons (package::function()) in this tutorial in
order to make it clear which package I the function resides in. It is not mandatory.
The above command will create a new directory with the following structure:
demopackage/
    .gitignore
    .Rbuildignore
    demopackage.Rproj
    DESCRIPTION
    NAMESPACE
    R/
The DESCRIPTION file contains metadata about your package, such as the name, version,
dependencies, and so on:
Package: demopackage
Title: What the Package Does (One Line, Title Case)
Version: 0.0.0.9000
Authors@R:
    person("First", "Last", , "first.last@example.com", role = c("aut", "cre"),
           comment = c(ORCID = "YOUR-ORCID-ID"))
Description: What the package does (one paragraph).
License: `use_mit_license()`, `use_gpl3_license()` or friends to pick a
    license
Encoding: UTF-8
Roxygen: list(markdown = TRUE)
RoxygenNote: 7.2.3
The NAMESPACE file is used to define which functions are exported from your package.
# Generated by roxygen2: do not edit by handThe R/ directory is where you will put your R code.
The other files.folders are auto-generated and not interesting for now.
17.3 Demo data
Many packages come with demo data that can be used to test the package.
I think it always a good idea to include some demo data in the package, also for my own development cycle,
so let’s start with that.
step 1 Create folders data/ and /data-raw/ in the package folder. Also add data-raw to the .Rbuildignore file:
^demopackage\.Rproj$
^\.Rproj\.user$
data-raw
step 2 Create a new R script called DATASET.R in the data-raw/ directory .
Contents of DATASET.R:
create_demo_data <- function() {
    time_mins <- c(0, 16, 32, 48, 64, 80, 96, 112, 128, 144, 160)
    OD600_A1 <- c(0.023, 0.035, 0.059, 0.099, 0.167, 0.256, 0.349, 0.491, 0.684, 0.821, 0.916)
    OD600_A2 <- c(0.022, 0.031, 0.062, 0.103, 0.174, 0.263, 0.358, 0.508, 0.691, 0.826, 0.927)

    OD600_B1 <- c(0.023, 0.022, 0.027, 0.051, 0.074, 0.099, 0.123, 0.178, 0.263, 0.341, 0.382)
    OD600_B2 <- c(0.018, 0.019, 0.024, 0.047, 0.067, 0.085, 0.109, 0.165, 0.243, 0.308, 0.342)

    data <- data.frame(minutes = time_mins,
                       OD600_control_A = OD600_A1,
                       OD600_control_B = OD600_A2,
                       OD600_agentX_A = OD600_B1,
                       OD600_agentX_B = OD600_B2)

    growth_data <- tidyr::pivot_longer(data = data,
                       cols = 2:5,
                       names_to = c("condition", "duplo"),
                       names_pattern = "OD600_(control|agentX)_(A|B)",
                       values_to = "OD600")

    usethis::use_data(growth_data, overwrite=TRUE)
}

create_demo_data()
Step 3 Run the above script in the console of RStudio.
Note the call of usethis::use_data(growth_data, overwrite=TRUE) at the end of the function.
This takes care of creating the growth_data.rda R data object in data/ that will be published with you package.
I used the tidyr::pivot_longer function to transform the data from wide to long format.
Run devtools::load_all() in the console of RStudio to load the package into the current R session.
Output will be something like:
ℹ Loading demopackage
✔ Saving 'growth_data' to 'data/growth_data.rda'
• Document your data (see 'https://r-pkgs.org/data.html')
Do not ignore warnings! The warning about documenting your data is important.
Now, when you type in the console growth_data, or demopackage::growth_data,
you will see the data object printed to the console.
# A tibble: 44 × 4
   minutes condition duplo OD600
     <dbl> <chr>     <chr> <dbl>
 1       0 control   A     0.023
 2       0 control   B     0.022
 3       0 agentX    A     0.023
 4       0 agentX    B     0.018
 5      16 control   A     0.035
 6      16 control   B     0.031
 7      16 agentX    A     0.022
 8      16 agentX    B     0.019
 9      32 control   A     0.059
10      32 control   B     0.062
# ℹ 34 more rows
# ℹ Use `print(n = ...)` to see more rows
You may have noticed the • Document your data (see 'https://r-pkgs.org/data.html')
in the load_all() output above.
Let’s proceed with that, following the guidelines mentioned in the link.
First, create a new R script in the R/ directory called data.R.
In it, put the documentation of your dataset, followed by its -quoted- name:
#' Demo bacterial growth data
#'
#' A small fictitious dataset with duplo's for two conditions of growth medium.
#'
#' @format ## `growth_data`
#' A data frame with 44 rows and 4 columns:
#' \describe{
#'   \item{minutes}{Minutes elapsed since T0}
#'   \item{condition}{Growth condition; a control and a medium additive}
#'   \item{duplo}{Duplo A or B}
#'   \item{OD600}{The OD600, or Optical Density measured at 600 nm wavelength}
#' }
#' @details
#' Additional details...
#'
"growth_data"
The documentation is written in Roxygen2 format, which is a way to write documentation in the source code of your package.
The roxygen2 package will parse this and create the documentation for you.
The @export tag at the end is used to indicate that this dataset is meant to be used by the users of your package.
To make this available, we first call devtools::document() and then type ?growth_data in the console to see the documentation.
It looks like this:
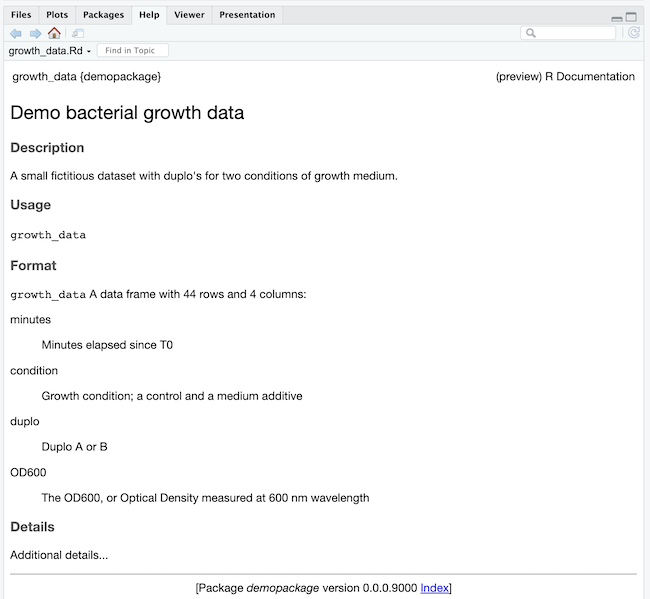
Your package folder now has an additional folder man with a file growth_data.Rd in it;
the same documentation, but now in Latex format. This is the file that contains the documentation
that you just wrote.
Here is the current status of the project folder.
demopackage/
    .gitignore
    .Rbuildignore
    demopackage.Rproj
    DESCRIPTION
    NAMESPACE
    data/
        growth_data.rda
    data-raw/
        DATASET.R
    man/
        growth_data.Rd
    R/
        data.R
17.4 Writing functions
Let’s add some functionality to the package.
A warning: Do not use library(package) statements in your package scripts; they should be dealt with in another way.
Create a new R script in the R/ directory called plot_growth_curves.R.
In it, put the following function:
plot_growth_curves <- function(growth_data, add_smoother=FALSE) {
    plt <- ggplot2::ggplot(data = growth_data,
                           mapping = ggplot2::aes(x = minutes,
                                         y = OD600,
                                         linetype = duplo,
                                         shape = duplo,
                                         color = condition)) +
           ggplot2::geom_point() +
           ggplot2::theme_minimal()
    if (add_smoother) {
        plt <- plt + ggplot2::geom_smooth(se = F, formula = 'y ~ x', method = "loess")
    }
    print(plt)
}
and don’t forget to add the dependency on the two tidyverse packages in the DESCRIPTION file:
Imports:
    tidyr,
    ggplot2
In this example, I always use the ggplot:: prefix. This is the easiest way to use dependencies.
If you don’t want this (because it is a bit verbose), you can use importFrom in the NAMESPACE file.
See details for this in the R Packages book.
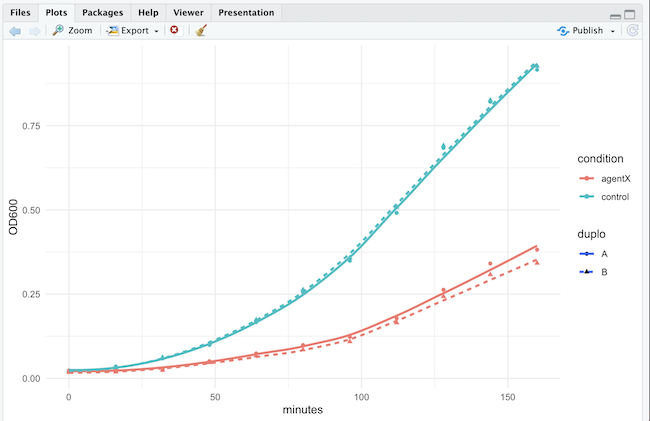
Now, after devtools::load_all() we can use the package function:
demopackage::plot_growth_curves(demopackage::growth_data)
#OR
plot_growth_curves(growth_data)
Let’s finish with the function documentation:
#' Plot bacterial growth data
#'
#' Plots bacterial growth curves with duplos and multiple conditions.
#'
#' @param growth_data A tibble of data frame in long format, similar to the growth_data demo table of this package.
#' @param add_smoother A logical indicating whether to add a smoother to the plot.
#' @returns Nothing
#' @examples
#' plot_growth_curves(growth_data)
#' plot_growth_curves(growth_data, add_smoother = TRUE)
#' @details
#' Additional details...
#'
#' @export
Finally, run devtools::document() and devtools::load_all() to test the function and its documentation.
I know, this smoother is not the most appropriate fit for this type of data, but couldn’t be bothered to find a better one for this example.
Finally, let’s update the DESCRIPTION file with the new function and its documentation:
The DESCRIPTION file should now look something like this:
Package: demopackage
Title: A package for plotting bacterial growth curves.
Version: 0.0.1.000
Authors@R:
    person("Michiel", "Noback", , "michiel.noback@example.com", role = c("aut", "cre"))
Description: A package for plotting bacteria growth curves in a user-friendly way.
License: `use_mit_license()`
Encoding: UTF-8
Roxygen: list(markdown = TRUE)
RoxygenNote: 7.2.3
Imports:
    tidyr,
    ggplot2
Depends:
    R (>= 2.10)
LazyData: true
and the NAMESPACE file should look like this (DON’T EDIT THIS FILE BY HAND):
# Generated by roxygen2: do not edit by hand

export(plot_growth_curves)
The dataset growth_data is not present in the NAMESPACE file. Datasets are dealt with in a different way by R.
17.5 Publish the package
If you want to share your package with the world, you can publish it on GitHub, or on CRAN.
CRAN has a lot of rules and guidelines that you need to follow; I won’t go into that here.
For GitHub, you can use the usethis::use_github() function, but I prefer to take matters in my own hands.
These are the steps:
- Add a
.gitignorefile to your package folder withusethis::use_git_ignore(). It should have the entries.Rproj.user,*.Rprojand.Rhistory - Init a github repository in your package folder with
git init. - Create a new repository on GitHub (in my case https://github.com/MichielNoback/R-demo-package).
- Add the remote with
git remote add originand the URL of your repository. - Add a Readme.md; you can create a stub file with
usethis::use_readme_md(). Don’t forget to edit it! -
git add,git commitandgit pushto the remote.
Here is the final status of the project folder.
demopackage/
    .git/
    .Rproj.user/
    data/
        growth_data.rda
    data-raw/
        DATASET.R
    man/
        growth_data.Rd
        plot_growth_curves.Rd
    R/
        data.R
        plot_growth_curves.R
    .gitignore
    .Rbuildignore
    .Rhistory
    demopackage.Rproj
    DESCRIPTION
    NAMESPACE
    README.md
Others can now install this package with devtools::install_github("MichielNoback/R-demo-package").